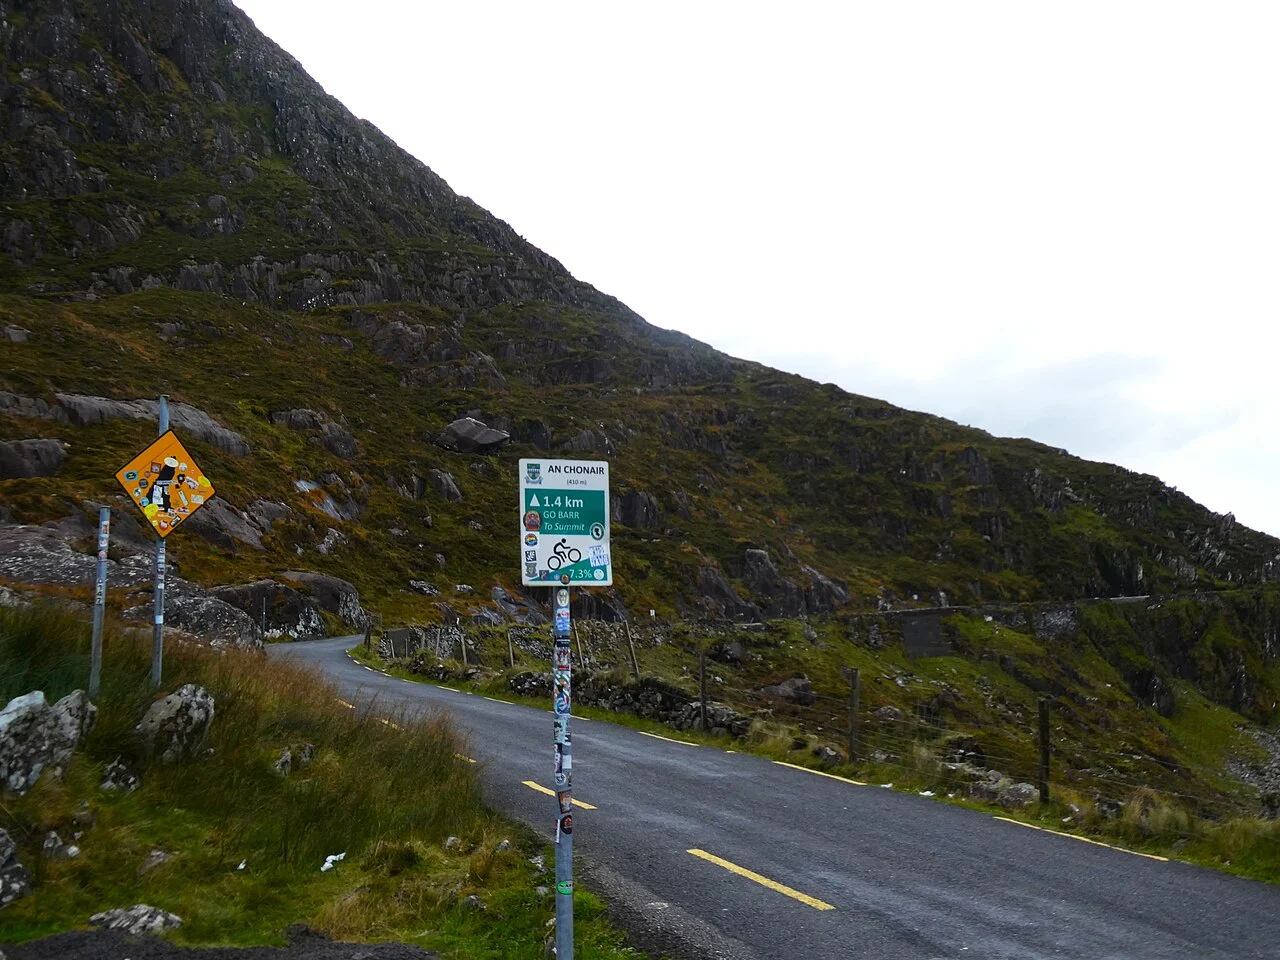
A 10% climb rises 10 metres for every 100 metres covered horizontally. The Civiglio at Il Lombardia 2026 comes close: 4.2 km with 406 m of elevation gain and an average gradient of 9.7%. The head of the race climbed it in 12′16″.
In brief
- Gradient is elevation gain divided by horizontal distance: 10% is one metre up for every ten forward.
- On the flat, the air takes most of the watts of a 280 W amateur; on the steepest climb in the chart, gravity takes almost all of them. That is why 10% is not double 5%.
- The WorldTour peloton climbs at an average VAM of 1300-1400 m/h, and the best reach 1600-1800 m/h on the decisive climbs.
- One kilo less is worth about 20 seconds on the climb in our examples for the amateur and about 15 for the professional.
- A climb’s watts per kilo should always be read as a range, and the one-hour threshold written as “at least”.
The thread running through it is the comparison with the Selvino, the long, gentle climb of the same race, which returns at the end as the climb to try with your own time on the Climb timer.
Gradient in one line
Gradient is elevation gain divided by horizontal distance, expressed as a percentage. If a road gains 6 metres for every 100 covered, the climb is at 6%. The number does not say how long the climb is: it only says how steep it is at every point.
To know how much you climb in total, you need the kilometres. The Selvino measures 10.1 km and gains 596 m: an average gradient of 5.9%. Divide 596 by 10,100 metres and the sum checks out.
That is why the sign alone is not enough. A 10% over 3 km takes you 300 metres higher, a 10% over 10 km takes you 1000: same gradient, different elevation gain and an effort that is nothing alike. Reading a sign that says “10%” means knowing how steep the road is, not how much of it is left.
Average gradient, maximum gradient and elevation gain
The average hides the hard stretches. The Selvino has an average of 5.9% and a maximum of 9%. Giovenzana is another story: 3.6 km, 334 m of elevation gain, an average of 9.2% and a maximum of 16%.
That 16% is the hardest point, not the typical stretch. These are three numbers with three jobs: elevation gain says how much you climb, the average how steep the climb is overall, the maximum where the hardest point is.
Then there are the off-the-scale gradients. In Lachlan Morton’s Everesting attempt, in June 2020, the climb averaged 11.1% with a maximum of 13.2%. In Sean Gardner’s, in October 2020, the average was 15.5% and the maximum 22.6%.
Where the watts go when the road climbs
At 0% air wins, at 9% gravity does
At constant speed, a rider’s power is the sum of three terms: gravity, which depends on the mass of rider and bike and on the sine of the gradient; the rolling of the wheels on the asphalt; and the air, which slows you in proportion to the square of speed. Drivetrain losses are small and are counted with a chain efficiency of about 0.97.
Going uphill, gravity grows with the gradient while the air shrinks, because you go slower. Rolling matters little in every case, but its share thins out as well.
Take the 280 W, 75 kg amateur from our examples. On the flat, almost everything goes into pushing air aside.
A gentle climb is enough for gravity to become the biggest term. On the steepest gradient in the chart the air has almost vanished and all that is left is the weight to lift.
10% is not double 5%
In a 40 km time trial with wind, between two riders with thresholds of 340 and 320 W, the 20 km headwind section is worth 194 seconds of gap, the tailwind one only 17: you gain more where you go slowly. On a climb, where speed is low, the same principle applies.
From this you can see why 10% is not double 5%: it is not only the watts needed to climb that change, but also what consumes them.
Watts per kilo: why weight matters more uphill
The sum
- 280 W ÷ 65 kg = 4.3 W/kg
- 280 W ÷ 75 kg = 3.7 W/kg
The sum
- Amateur, 75 kg and 280 W: 34′17″; one kilo less: 33′57″.
- Professional, 65 kg and about 335 W: 26′46″; one kilo less: 26′31″.
One kilo is worth 20 seconds to the amateur and 15 to the professional.
Watts per kilo divide power by weight
Watts per kilo is power divided by weight. With the same 280 W the value changes from one body to another: 4.3 W/kg at 65 kg, 3.7 W/kg at 75 kg. Uphill, this ratio decides; on the flat, absolute watts count for more.
The sum
- 280 W ÷ 65 kg = 4.3 W/kg
- 280 W ÷ 75 kg = 3.7 W/kg
With equal watts, the lighter rider has the advantage on the climbs. With equal watts per kilo, on the flat it is the heavier rider who goes faster. Uphill the enemy is gravity and the watts-per-kilo ratio is one of the best predictors; on the flat aerodynamics counts and weight matters little, which is why good time triallists are often big riders.
Every extra kilo is paid for where gravity counts. Joe Friel uses the example of a backpack of about 4.5 kg in an all-out test, which lowers relative VO2max and speed; the same goes for a cyclist on a long climb, much less so on the flat.
Weight matters more on the steep climb
Not all climbs weigh the same. In Horvath and Andersson’s analysis, the optimal mass exponent, that is, the right way to divide watts by weight, grows with the gradient: 0.3834 on the flat with no wind, up to 0.8929 on the steepest climb considered. With an exponent of 1 the ratio is ordinary watts per kilo, so the closer you get to it, the more weight decides. In the Monaco-Nice time trial of 2024, with almost no net elevation gain but with steep climbs, the course favoured climbers over time triallists.
One kilo less is worth about 20 seconds on the Selvino for the 280 W, 75 kg amateur (34′17″ against 33′57″) and about 15 for the 335 W, 65 kg professional (26′46″ against 26′31″). For reference values, see the guide to what an amateur and a professional are worth in watts per kilo; to do the sums with your own weight, use the Climb timer.
The sum
- Amateur, 75 kg and 280 W: 34′17″; one kilo less: 33′57″.
- Professional, 65 kg and about 335 W: 26′46″; one kilo less: 26′31″.
One kilo is worth 20 seconds to the amateur and 15 to the professional.
VAM: metres of elevation gain per hour
VAM puts into a single number how fast you climb. To convert to watts per kilo you need the physical model of gravity, air and rolling, the one behind the Climb timer.
The VAM formula
VAM, velocità ascensionale media (average ascent speed), is the rate at which you gain altitude, in metres per hour. Michele Ferrari introduced it in 2003 and it is written as 3600 times ground speed times the sine of the gradient.
In practice two figures are enough: elevation gain and minutes of climbing. Multiply the metres by 60 and divide by the minutes. The result is the vertical metres gained in an hour, as if the climb lasted sixty minutes. The guide to VAM and how to calculate it has the rest.
The same VAM is not the same effort
At constant power, VAM grows with the gradient, and no gradient maximises it: the limit is the power you can sustain. In the model, with 375 W and 111 kg, the gradient found is 9.184% and the VAM 1040 m/h.
On steep gradients you go slowly and the air counts for less, so VAM rises more easily. VAM is linearly tied to watts divided by weight, but at equal VAM the watts per kilo drop if the gradient is lower.
The comparison between 5% and 15% shows it. At equal VAM, 5% needs a higher horizontal speed than 15%, and therefore far more power against the air. That is why the watts-per-kilo estimate cannot be a single shortcut.
The Climb timer on the Selvino
The Selvino measures 10.1 km and the head of Il Lombardia 2026 climbed it in about 26′46″, at roughly 4.5-6.0 W/kg. Try it with your own time on the Climb timer: the curve gives the minutes for each value of watts per kilo, with the dot for the professionals, and the calculator does the sum with your time.
Selvino
10.1 km 5.9% average 596 m elevation gain
Enter a rider’s climbing time: the watts per kilo, with their range, and the VAM will appear here.
4.4 W/kg approx.
between 4.0 and 4.9 W/kg
- VAM
- 1,192 m/h
- Average speed
- 20.2 km/h
- Power
- about 330 W
| Power | Time | Speed |
|---|---|---|
| 5.0 W/kg | 26'50" | 22.6 km/h |
| 5.5 W/kg | 24'53" | 24.4 km/h |
| 6.0 W/kg | 23'15" | 26.1 km/h |
| 6.5 W/kg | 21'53" | 27.7 km/h |
| 7.0 W/kg | 20'43" | 29.2 km/h |
How we calculate it
Physical model by Martin and colleagues (1998): gravity, rolling resistance, air (on the rider and on the wheels) and bearing friction, at constant speed and gradient. Central assumptions: bike and equipment 8.0 kg, rolling resistance 0.0040, aerodynamic drag area 0.32 m², drivetrain efficiency 97.6%, air density 1.09 kg/m³ (average altitude 1,000 m), no wind.
The range is the result with all the favorable assumptions (drafting, a 1.5 m/s tailwind, a light bike) and with all the unfavorable ones (riding alone, a headwind, a heavier bike). These estimates are typically off by 6–10% (Millet, Tronche and Grappe, 2014): that’s why we never give a single number. A rider who surges and eases off spends a little more for the same time. VAM, the meters climbed in an hour, is a measurement instead: it depends only on elevation gain and time.
A climb says how hard you pushed that day, not how hard you can push. Threshold, the effort of about an hour, is always written “at least”: for the head of the race on the Selvino it would be at least about 4.4-5.7 W/kg.
The WorldTour peloton climbs at an average VAM of 1300-1400 m/h, and the best reach 1600-1800 m/h on the decisive climbs and for long durations. An average club cyclist cannot hold that pace for more than a few minutes. One example from someone who did the sums on themselves is a VAM of 1107 m/h held for 53 minutes at time-trial pace. Starting at 1400 m/h in the first kilometres signals a likely overspeed.
The professionals’ numbers on the measured climbs
The seven climbs of Il Lombardia 2026, all in the men’s race, show how the effort changes when the road changes. The short, steep ones, San Fermo della Battaglia and Civiglio, are where VAM is highest. The long, gentle one, the Selvino, is where watts per kilo are lowest.
| Climb | Time | VAM (m/h) | W/kg |
|---|---|---|---|
| Selvino | 26′46″* | 1.340 | 4,5-6,0 |
| Valpiana | 25′58″* | 1.460 | 5,1-6,4 |
| Giovenzana | 13′00″* | 1.540 | 4,9-5,8 |
| Madonna del Ghisallo | 19′19″ | 1.650 | 6,0-7,6 |
| San Fermo della Battaglia (1st) | 6′10″ | 1.900 | 6,7-8,3 |
| Civiglio | 12′16″* | 1.990 | 6,4-7,7 |
| San Fermo della Battaglia (2nd) | 6′17″ | 1.860 | 6,6-8,1 |
On the Madonna del Ghisallo the climbing is fast, the air weighs more than 15% and the estimate is weak.
Professionals produce their highest mean maximal powers on gradients of around 6-7%. In the mountains, durations over 10 minutes decide and performance is tied to watts per kilo, while on the flat absolute watts count.
WorldTour climbers weigh 63.8 kg on average and are 175 cm tall, against 74.5 kg and 183 cm for sprinters.
Where the number is not enough
Gradient, VAM and watts per kilo are models, and models have their limits.
VAM does not see wind and slipstream
VAM depends heavily on the accuracy of the altitude data and is more reliable on long climbs than on short ones. It does not see wind and slipstream. Climbs with downhill sections give artificially low values, while on a short, steep stretch a run-up can inflate the value.
Watts per kilo is not everything
In the model comparing professionals’ profiles, the optimal mass exponent is 0.7197 on a constant 2° climb (about 3.5%), between the flat value and that of a 7° climb (about 12%); with an exponent of 1 you get ordinary watts per kilo. The sum uses a rolling coefficient of 0.005 and an air density of 1.225 kg/m³. A kilo of bike then weighs more on the light rider than on the heavy one.
The typical climber (63.2 kg) has 5.93 W/kg at 2° and 5.75 W/kg at 7°; the typical sprinter (80.2 kg) has 5.17 W/kg at 2° and 4.93 W/kg at 7°.
On steep climbs, climbers can be beaten by more rounded riders, or even by sprinters on short, steep stretches. The model is worth less in bunch races, where slipstream and race dynamics count.
Altitude takes away power: above 3,000 metres, maximal mean power over 10 minutes was 15% lower than at sea level. In a study on juniors, FTP measured outdoors on a 6.7% climb was higher than that estimated in the laboratory.
Article written with the help of Mnemosyne.
Sources
- Horvath M., Andersson E.P., “Optimal body mass normalization of power output for accurate prediction of estimated cycling performance over complex time-trial courses”, Frontiers in Sports and Active Living, 2025, PMID 40901017, doi:10.3389/fspor.2025.1599319.
- Bos L., Slawinski M.A., Stanoev T., “On maximizing VAM for a given power: Slope, cadence, force and gear-ratio considerations”, arXiv:2006.15816 (preprint).
- Friel J., “The Cyclist’s Training Bible”, 5th ed., VeloPress, 2018.
- Valenzuela P.L., Leo P., Mateo-March M., Gallo G., Seiler S., Mujika I., “UCI Sports Nutrition Project: The Science of Successful Cycling Performance”, International Journal of Sport Nutrition and Exercise Metabolism, 2025, PMID 41265433, doi:10.1123/ijsnem.2025-0157.
- Garvican-Lewis L.A., Clark B., Martin D.T., Schumacher Y.O. and others, “Impact of Altitude on Power Output during Cycling Stage Racing”, PLoS ONE, 2015, PMID 26629912, doi:10.1371/journal.pone.0143028.
- Vinetti G., Rossi H., Bruseghini P., Corti M. and others, “Functional Threshold Power Field Test Exceeds Laboratory Performance in Junior Road Cyclists”, Journal of Strength and Conditioning Research, 2023, PMID 36692223, doi:10.1519/JSC.0000000000004471.
- “Il Lombardia 2026”, the race profile: the climb times and our watts per kilo.
- Photo: Mucklagh, CC BY-SA 4.0, via Wikimedia Commons.
