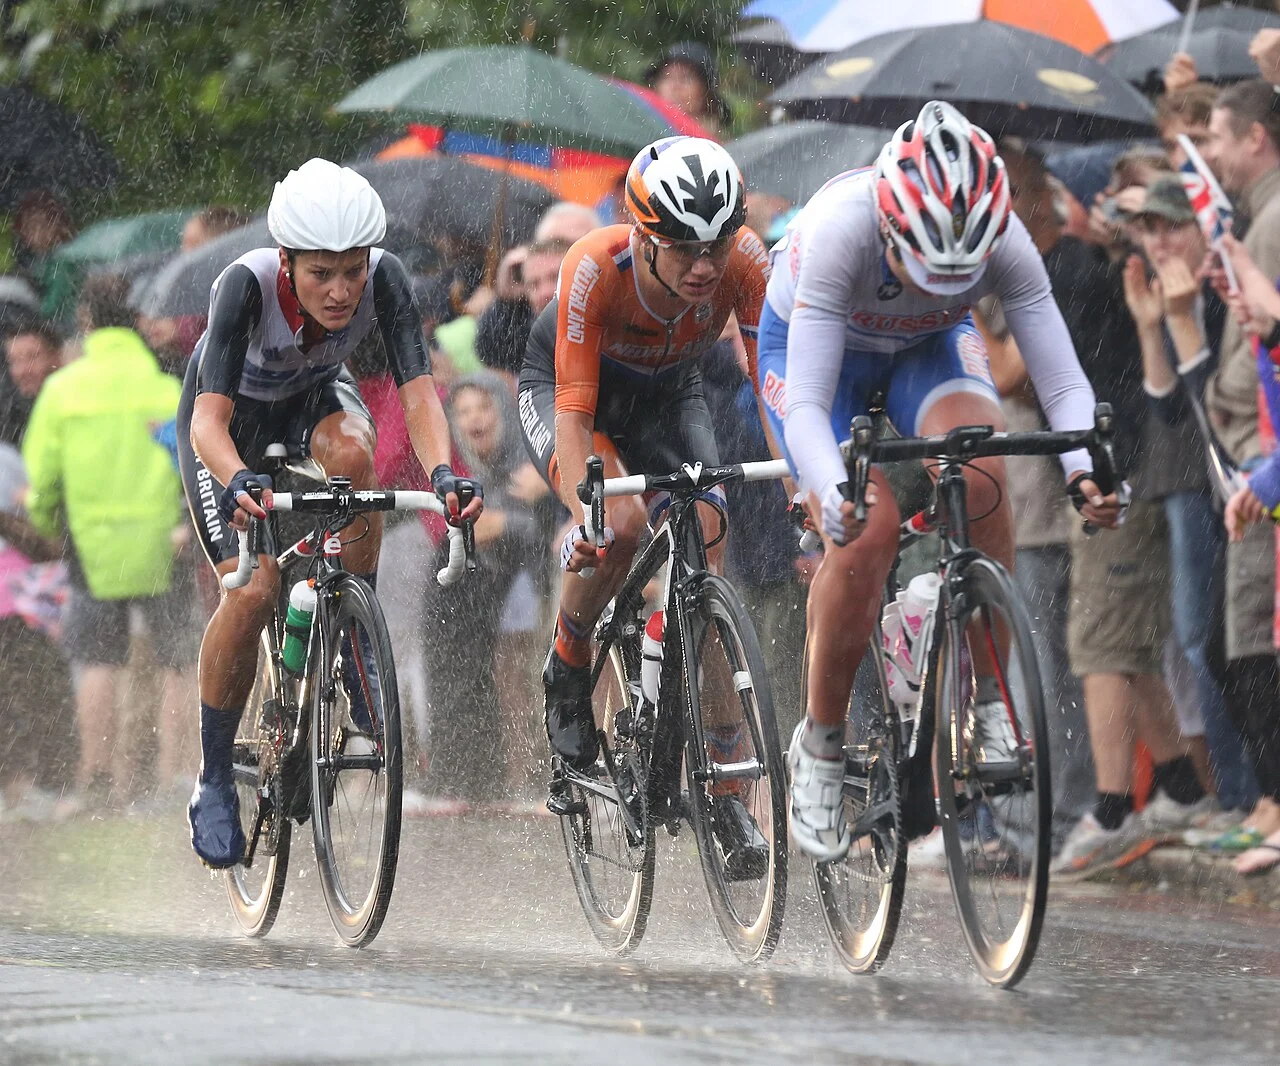
Selvino doesn’t know who is climbing it. The measures we use to read a race are the same for everyone: watts per kilo, threshold, VO2max. What changes is the starting point. Even genuinely elite female athletes have a VO2max, expressed in mL/kg/min, about 10% lower than men of equal level, and across all endurance events there is a steady gap of about 10-12%.
In brief
- Women’s absolute haemoglobin mass is 62.9% lower than men’s; relative to lean mass, the difference falls to 7.5%.
- After puberty, men’s testosterone is 15-20 times that of women.
- Studies on women are few and mostly involve amateur athletes.
- After 90 minutes at 110% of the gas exchange threshold, power at threshold fell less in women than in men.
Threshold and critical power, the line between an effort you can sustain for a long time and one that soon presents the bill, are similar in percentage terms in the two sexes. Women start with a smaller engine, but use it in a very similar way.
At equal watts per kilo, what changes in the body of someone climbing Selvino if she is a woman, and what doesn’t?
Watts per kilo in one line
The sum
- 280 W ÷ 65 kg = 4.3 W/kg
- 280 W ÷ 75 kg = 3.7 W/kg
What watts per kilo measures
Watts per kilo is watts divided by kilos: the power you push through the pedals divided by your weight. On a climb it is the number that matters, because gravity pulls on every kilo, yours and the bike’s. It is calculated the same way for a man and a woman, for a professional and for someone who climbs on Sundays.
Two measures always go with it. Threshold is the power you can sustain for an effort of about an hour. VO2max is the maximum amount of oxygen the body can use in a minute, usually written in mL per kilo of body weight per minute: it tells you how big the engine is, while threshold tells you how much of it you use for a long time. A 65 kg rider and a 75 kg rider pushing the same power have the same engine at the pedals but two different ratios, and on a climb the higher ratio wins.
The sum
- 280 W ÷ 65 kg = 4.3 W/kg
- 280 W ÷ 75 kg = 3.7 W/kg
Selvino, the reference climb
Selvino is our guiding climb. It measures 10.1 km and climbs 596 m at an average gradient of 5.9%.
VO2max: where the difference starts
Heart, lungs and haemoglobin
Women generally have a smaller heart, smaller lungs and less haemoglobin mass than men, and their haemoglobin concentration is 12% lower than that of men of the same age and origin. Haemoglobin is the wagon that carries oxygen to the muscles: fewer wagons, less oxygen arriving.
Absolute haemoglobin mass is 62.9% lower than in men; normalised to lean mass, the difference falls to 7.5%. After puberty, moreover, testosterone is 15-20 times higher in men than in women.
Much of the lower VO2max, 10-15%, comes down to cardiac output and oxygen-carrying capacity. Output is the blood the heart pumps with each beat: a smaller heart sends out less, and what arrives carries less. When normalised to lean mass, that is, with fat taken out of the sum, the difference shrinks but does not disappear.
The energy cost of running and swimming
The picture doesn’t all point one way. In swimming and running, women have a better energy cost relative to weight: in a study of distance runners, the oxygen spent on running is 9% lower at equal body weight. That is a running and swimming figure, not a cycling one, and it does not carry over to the pedals.
Threshold and critical power almost the same
| Measure | Women | Men |
|---|---|---|
| Lactate threshold in distance runners, running data (% of VO2max) | 85% | 83% |
| Critical power (% of peak power) | 74% | 72% |
| Curvature constant (J·Pmax-1) | 52 | 51 |
What stays the same
What doesn’t change is the shape of the curve. Lactate threshold, as a percentage of VO2max, is similar between the sexes, but the figure comes from distance runners, not female cyclists. The same goes for critical power as a percentage of peak power and for the curvature constant, which says how much the curve between power and duration bends. In cycling, relative critical power does not differ between men and women, but in absolute terms it is lower in women.
| Measure | Women | Men |
|---|---|---|
| Lactate threshold in distance runners, running data (% of VO2max) | 85% | 83% |
| Critical power (% of peak power) | 74% | 72% |
| Curvature constant (J·Pmax-1) | 52 | 51 |
Among distance runners, men, with a higher VO2max, stay faster at threshold even though their threshold, in percentage terms, is just below women’s. That is a running figure.
A trial on 18 trained cyclists, 8 of them women, tried to put them on an equal footing, with efforts calibrated to each one’s critical power. The result is the same time to failure in both sexes, in both the heavy and the severe trial.
Inside the muscle it’s another story
Inside the muscle, though, the story is not identical. The women showed smaller reductions in contractile function and greater oxygenation of the vastus lateralis, the outer muscle of the thigh; in the heavy trial the respiratory exchange ratio was lower. Same duration, same boundary, slightly different internal routes to reach it.
The longer the effort, the narrower the gap
In almost all endurance sports the performance gap between men and women is about 10-15%, and it narrows with duration of the event. Greater fat oxidation is linked to the shrinking gap.
Fats help over long distances
Women have a lower respiratory exchange ratio at every intensity: they burn more fat and less carbohydrate than men. The difference is there before and after training and is thought to be biological in origin.
Female muscle contains more intramuscular lipids, and during 90 minutes of submaximal effort their use is higher than in men.
World records and the advantage you can’t see
World records in running show it. In the marathon the gap between men and women is 7.80% (2h00’35” against 2h09’56”), in the 10,000 m 10.4%, in the 5000 m 10.9%. The longer the distance, the smaller the gap. These are running numbers: they do not transfer from running to cycling.
In ultramarathons, women’s theoretical advantage does not yet show in the results. Among the reasons are lower participation and carbohydrate-rich feeding, which cancels out the advantage of fats.
Durability: who fades less after 90 minutes
How durability is measured
Durability is the word for how much of yourself you keep after a prolonged effort. To measure it, 16 trained men (peak VO2 58 ± 6 mL·kg-1·min-1) and 16 trained women (51 ± 3) cycled for 90 minutes at 110% of the gas exchange threshold (GET), and researchers looked at how far the thresholds had fallen.
What falls and what doesn’t
The women lost less, both at the gas exchange threshold and at the respiratory compensation point. The values are widely spread. Peak VO2 and the associated power, on the other hand, fell similarly in the two sexes: the maximum went down in the same way, and what gave way more in men was the level that can be held for a long time.
Inside the muscle, too, fatigue had a different face. Lactate was higher in men, while the women showed lower muscle oxygen extraction and higher tissue saturation. The study describes what happens to trained cyclists, not professionals.
Iron, heat and bones: three differences
Not everything goes through the engine. Women are more than eight times as likely to be iron deficient as male athletes, and iron is needed to carry oxygen to where the pedalling happens.
The second concerns heat. In the luteal phase of the cycle, progesterone raises body temperature by about 0.5 °C and shifts the threshold for vasodilation and sweating upwards: the body starts to shed heat later, from a higher starting temperature.
The third concerns bones and tendons. Women have higher rates of stress fractures and anterior cruciate ligament tears, with a risk two to eight times that of male athletes, and are more exposed to relative energy deficiency (REDs), that is, available energy too low for the body’s needs.
The professionals: power as a percentage of threshold
Published data on professional women are rare. One of the few compares 64 power files from the winner of the Giro Rosa and the winner of the Giro d’Italia. In absolute terms, mean maximal power differs in every type of stage; as a percentage of FTP, the power you can sustain for about an hour, the two curves are very similar, with differences between 0.8 and 4.5%.
The drop with fatigue has a different threshold. Mean maximal power falls as the kJ per kilo spent increase only from 30 kJ/kg in women and from 45 kJ/kg in men. The 20-60 minute values, in both, were exceptionally high.
Where the curves diverge, in the first 50% of flat stages (14.7-15.1%) and in the last 25% of mountain ones (9.8%), the difference is attributed to tactics and perhaps to climbing ability. Here lies the limit: one woman and one man, the winners of two races, and not a rule for all professionals.
The professional men’s numbers on the climbs
To understand what all this means at the top of a climb, you need real numbers. The seven climbs measured at Il Lombardia 2026, from Selvino to San Fermo della Battaglia, give very different ranges of watts per kilo, because the duration of the effort changes. On the Ghisallo they climb fast, air resistance weighs more than 15% and the estimate is weak.
These are climbs from a men’s race. For how to read a W/kg value, there is the guide on watts per kilo, amateur and professional, and for climbing speed the one on VAM.
You enter your own time, choose your weight, and the curve tells you how many watts per kilo it corresponds to. More climbs and times are in the Climb timer.
Selvino
10.1 km 5.9% average 596 m elevation gain
Enter a rider’s climbing time: the watts per kilo, with their range, and the VAM will appear here.
4.4 W/kg approx.
between 4.0 and 4.9 W/kg
- VAM
- 1,192 m/h
- Average speed
- 20.2 km/h
- Power
- about 330 W
| Power | Time | Speed |
|---|---|---|
| 5.0 W/kg | 26'50" | 22.6 km/h |
| 5.5 W/kg | 24'53" | 24.4 km/h |
| 6.0 W/kg | 23'15" | 26.1 km/h |
| 6.5 W/kg | 21'53" | 27.7 km/h |
| 7.0 W/kg | 20'43" | 29.2 km/h |
How we calculate it
Physical model by Martin and colleagues (1998): gravity, rolling resistance, air (on the rider and on the wheels) and bearing friction, at constant speed and gradient. Central assumptions: bike and equipment 8.0 kg, rolling resistance 0.0040, aerodynamic drag area 0.32 m², drivetrain efficiency 97.6%, air density 1.09 kg/m³ (average altitude 1,000 m), no wind.
The range is the result with all the favorable assumptions (drafting, a 1.5 m/s tailwind, a light bike) and with all the unfavorable ones (riding alone, a headwind, a heavier bike). These estimates are typically off by 6–10% (Millet, Tronche and Grappe, 2014): that’s why we never give a single number. A rider who surges and eases off spends a little more for the same time. VAM, the meters climbed in an hour, is a measurement instead: it depends only on elevation gain and time.
Where the science still disagrees
Few studies on women and very few on elites
The first problem is one of numbers. Women are under-represented in sports research: in a 2014 study they were about 35% of participants. Most studies on women involve amateur athletes, and top-level athletes are rarer still: for almost every topic there is less data on elite women than on elite men.
The second is what to do with it. The authors of the durability study believe that the smaller drops in thresholds in women suggest considering sex-specific training and pacing strategies.
Training time and the return to Selvino
The third is time. With the same training programme over a year, left ventricular mass and VO2max keep growing for longer in men: women stop after three months, men carry on until the ninth. A meta-analysis of eight studies finds bigger VO2max gains in men, but only three studies lasted more than eight weeks.
So we come back to Selvino. The climb is the same for everyone. The starting points change: a VO2max about 10% lower even among elite female athletes, a threshold that is almost equal in percentage terms, a fatigue that apparently is paid for differently. Where the meeting point lies, for now, only a few studies can say.
News written with the help of Mnemosyne.
Sources
- Santisteban K.J., Lovering A.T., Halliwill J.R., Minson C.T., “Sex Differences in VO2max and the Impact on Endurance-Exercise Performance”, International Journal of Environmental Research and Public Health, 2022, PMID 35564339, doi:10.3390/ijerph19094946.
- Holdsworth D.A., O’Leary T.J., Doig C.L., Taylor N., Dosanjh J., Woods D.R., Stacey M.J., Gifford R.M., “Physiological Basis of Sex Differences in Human Performance and Exercise-Associated Pathology”, Clinical Endocrinology, 2026, PMID 42057283, doi:10.1111/cen.70150.
- Ansdell P., Škarabot J., Atkinson E., Corden S., Tygart A., Hicks K.M., Thomas K., Hunter S.K., Howatson G., Goodall S., “Sex differences in fatigability following exercise normalised to the power-duration relationship”, Journal of Physiology, 2020, 598(24):5717-5737, PMID 32964441, doi:10.1113/JP280031.
- Pastorio E., Spillane P., Squires E., Benyahia L., Wilson H.K., Swain P., Colosio M., Felles C., Menditto A., Clarke S., Minion B., Pearmain W., Brownstein C.G., Porcelli S., Ansdell P., “Sex Differences in Durability Following Heavy Intensity Cycling Exercise in Trained Athletes”, Scandinavian Journal of Medicine & Science in Sports, 2026, PMID 41954088, DOI 10.1111/sms.70273.
- “Il Lombardia 2026”, the race page: the climb times and our watts per kilo.
- Photo: Diliff, CC BY-SA 3.0, via Wikimedia Commons.
